Skip to content
Aditya Aryan, home

Aditya Aryan

Role
AI/ML & Analytics Engineer
Location
New York City, NY
Local time
Current local time in New York: ET
  • 01NYC subway reliability pipeline
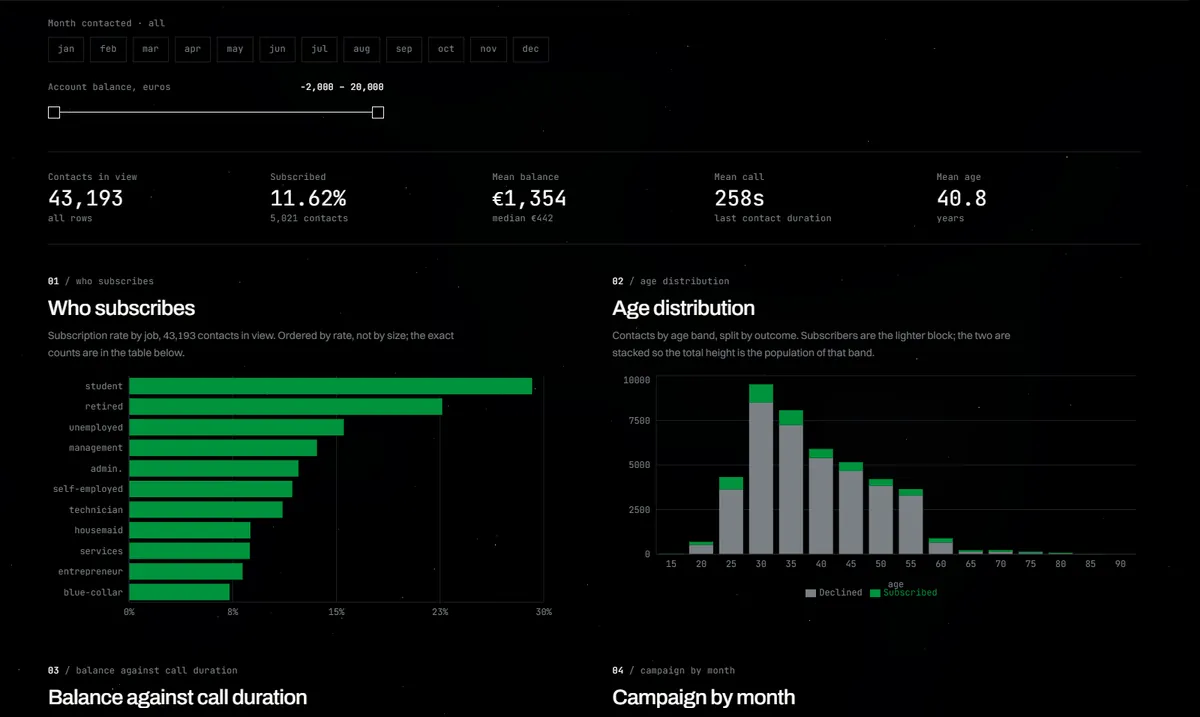
  • 02Bank marketing strategy
  • 1.2M+transaction records analysed

02 / selected work / 2022–2026

Eight things I built.

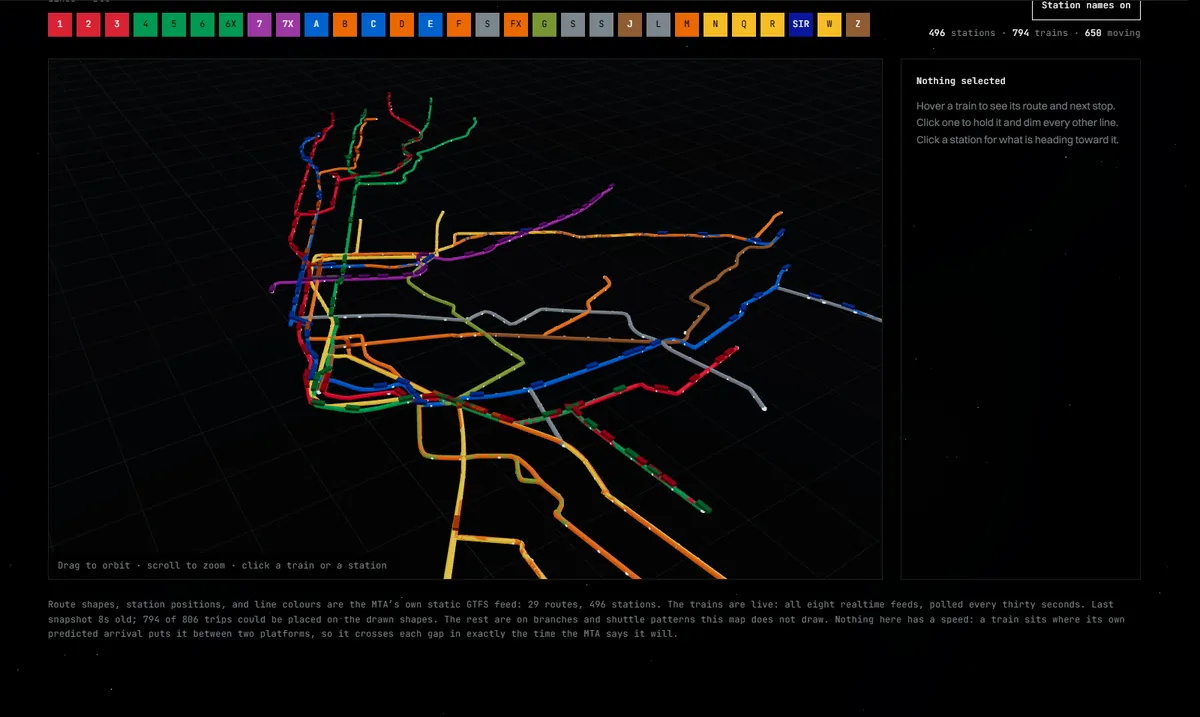
NYC subway reliability pipeline

The MTA never records when a train actually arrives. This pipeline infers it.

Open case study

How I approach a problem

01 / The Goal

Start with what you're actually trying to do.

Before I build anything I want to know what the goal is. You can make a hundred dashboards, or train a model that scores beautifully, but if they're not pointed at what you're trying to decide, it's just noise. So I'd rather start there and work backwards to the data. That means pinning down the words too. What counts as a customer, when someone has actually churned. A model gets asked to predict exactly that, so it gets written down first.

02 / What it records

Every table is a record of a process, not of the world.

The usual starting position is a lot of data sitting in different systems and nobody fully trusting any of it. So I go and find what writes each row, when it fires, and the one everybody skips: what it does when nothing happens. A missing row is a claim too. And a model learns whatever the table says, not what actually happened. If a column only gets filled in after the outcome, the model is quietly reading the answer.

03 / Make it correct

Before analysis or a model, the raw data has to be right.

Duplicates, gaps, records that don't line up across systems. It isn't glamorous and it's most of the job, machine learning included: a model trained on bad rows is just wrong with confidence. What actually matters comes next: set up the checks so it stays clean, instead of me fixing the same thing every month. Checks that run on every load, and notice when new data stops looking like what the model learned from.

04 / The Model

Give it a shape, then teach it.

Two models, really. First the data model: facts in the middle, dimensions around them, one row meaning exactly one thing, so the same question stops getting two answers. Then, if the goal needs a prediction, the machine learning one. I start with the simplest thing that could work, hold back data it has never seen, and only reach for something bigger when it earns it on that test. Boring first. Boring is what somebody else can pick up.

05 / The so what

What sells the most isn't always what makes the most money.

Then the actual thinking. Ranking by revenue tells you what's popular; ranking by margin tells you what's worth pushing. Same with a model: a good score isn't the answer. What is it leaning on, and would you have it before the decision? A dip in the middle of the year is a question, not a finding. When the numbers are right people make better calls. When they're wrong, everyone's just guessing with confidence.

06 / The Dashboard

Open it, ten seconds, know where you stand.

It ends as something somebody actually uses. Usually a screen: whoever's running the business should understand its health in about ten seconds, then dig in. Sometimes it's a model on a production line, making the call in milliseconds. I build it backwards from the questions they'd actually ask, and keep watching it after it ships. When it stops answering the question, the goal at the top was wrong. Which is where you go back to.
03 / experience / jun 2022 – dec 2025

Three roles, one throughline.

  1. 03May 2025 – Dec 2025

    Machine learning & data engineer, computer vision

    Nissha Medical Technologies · Buffalo, NY

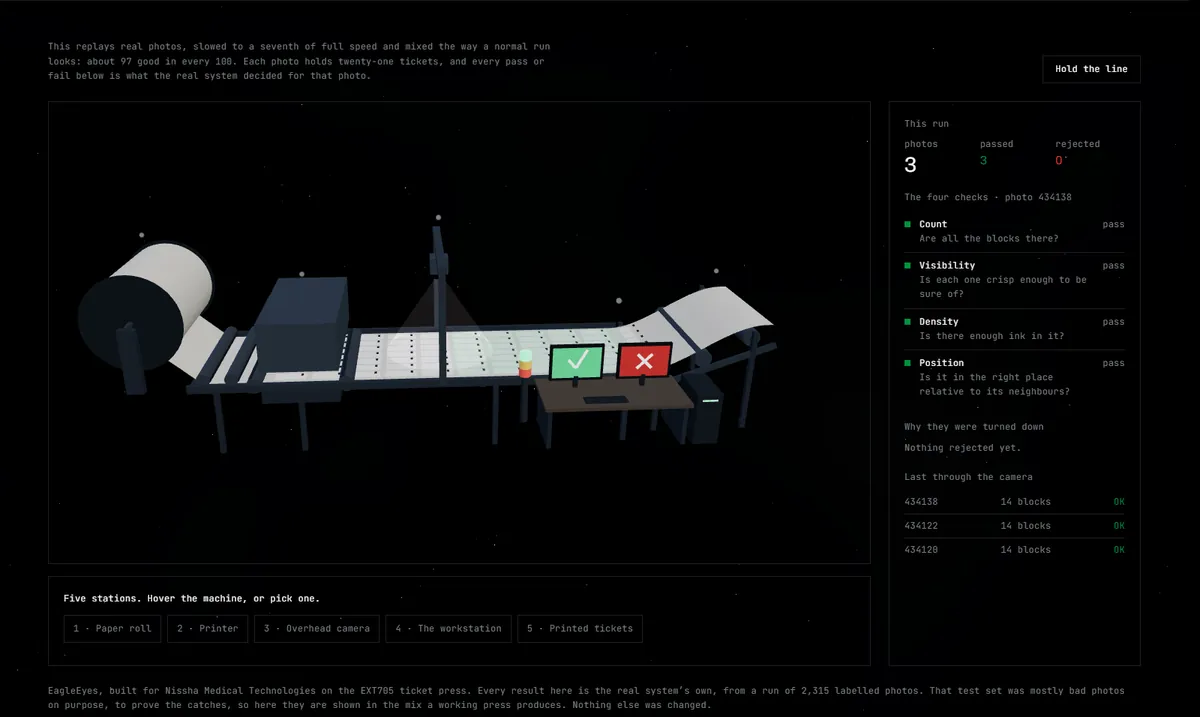
    • Built a camera system that checks printed tickets as they come off the press and catches the bad ones. I trained the model that finds the print marks and wrote the checks that decide pass or fail, so every decision can be explained.
    • Made it fast enough to keep up with the line. It runs on a small computer sitting right at the press, so a ticket gets checked in a fraction of a second and not after the fact.

    Python · PyTorch · YOLOv8 (Ultralytics) · OpenCV · NumPy · ONNX · TensorRT · CUDA

  2. 02Mar 2024 – Jul 2024

    Machine learning engineer & data analyst

    Constituents AI & Technology · Remote

    • Built a model that reads customer reviews and works out how people actually feel about a product: what they love, what frustrates them, what keeps coming up. Leadership used it to decide where to focus on keeping customers.
    • Built dashboards for the marketing and operations teams so they could answer their own questions, and forecast demand so planning wasn't guesswork.

    Python · scikit-learn · NLP · Prophet · SQL · PostgreSQL · Power BI · Airflow

  3. 01Jun 2022 – Mar 2024

    Data Analytics & Reporting Specialist

    Google (via Smollan) · Remote

    • Joined right as the project was starting and helped build the data setup from the ground up: what data we needed, where it came from, and how it all connected.
    • Fixed the data behind the reports leadership relied on, then set up checks so it stayed clean instead of me fixing the same thing every month. Once it was solid, I forecast demand so the business could plan ahead.

    GCP · BigQuery · Python · Looker Studio · Google Slides · MySQL

04 / capabilities / 54 entries

What the work is built with.

Languages & tools
  • SQL
  • Python (pandas, NumPy, scikit-learn)
  • R
  • DAX
  • Power Query
  • Git & GitHub Actions
  • Docker
  • PyTest
Machine learning & AI
  • PyTorch
  • Computer vision (YOLOv8, OpenCV)
  • NLP & sentiment analysis
  • LLMs
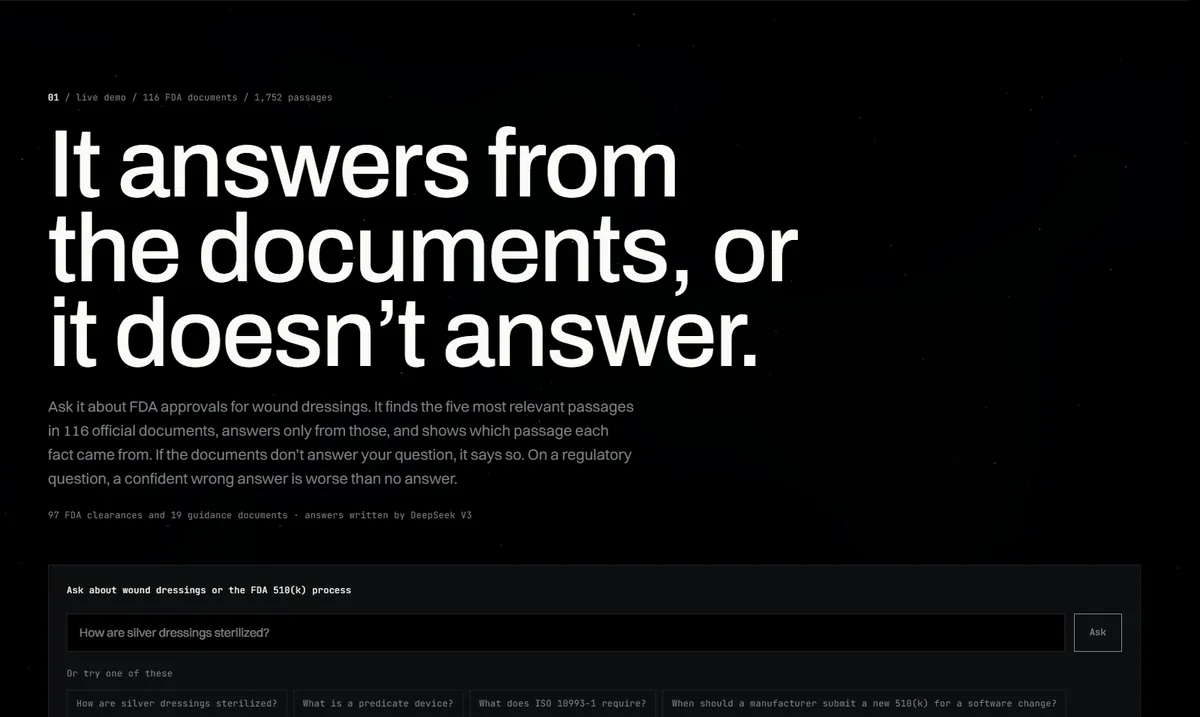
  • RAG
  • Prompt engineering
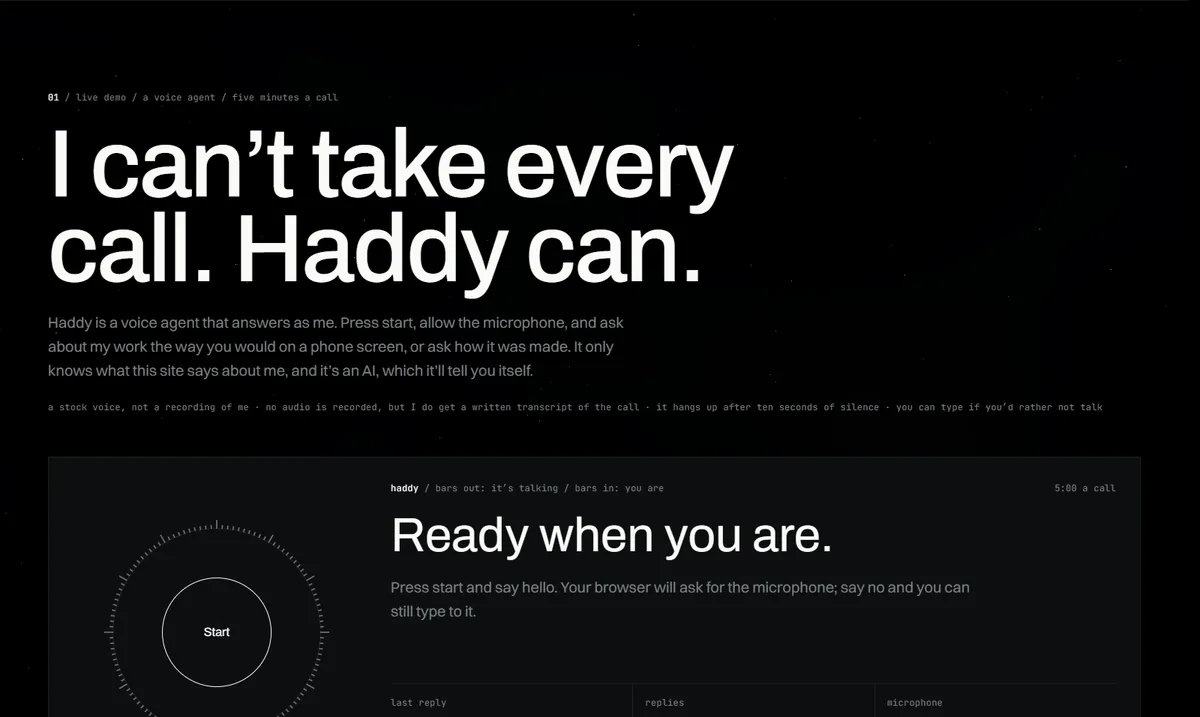
  • Voice agents (LiveKit, WebRTC)
  • Edge deployment (ONNX, TensorRT)
  • MLOps
Statistical methods
  • Regression
  • Classification (gradient boosting, random forest)
  • Time-series forecasting (Prophet)
  • A/B testing
  • Hypothesis testing
  • Cohort & retention
  • Segmentation
  • Feature engineering
  • EDA
Analytics & reporting
  • Power BI
  • Looker Studio
  • Tableau
  • Excel
  • Microsoft Fabric
  • Dash & Plotly
  • KPI dashboards
  • Data storytelling
  • Executive reporting
  • Google Slides
Data operations
  • ETL/ELT
  • dbt
  • Airflow
  • Spark
  • Dimensional/star-schema modeling
  • Warehousing
  • Cleansing
  • Validation (Great Expectations)
  • Governance
Platforms & databases
  • BigQuery
  • Snowflake
  • GCP/AWS/Azure
  • PostgreSQL
  • MySQL
  • SQL Server
  • DuckDB
  • SQLite
  • Vector DBs (Qdrant)

05 / off the clock / new york city, ny

A little more about me.

The parts a résumé leaves out.

local time

  :  

New York City, NY

Naruto key art: Kakashi, Sakura, Sasuke and Naruto leaping forward together.

currently watching

Naruto

A purple and pink Fennec on the pitch, the ball behind it.

currently playing

Rocket League

Aditya in the gym mirror, phone up, leaning on a blue cable machine.

most evenings

Gym

Espresso pulling from a machine into a small cup, steam rising off it.

runs on

Coffee

06 / contact / new york city / eastern

Let’s talk.

ML, analytics engineering and data roles, or honestly anything where messy data has to become something people can decide from.

Based
New York City, NY